Living in San Juan del Sur
Climate, distances, population and housing in San Juan del Sur, from public data. Looking for a home here? Tell us what you need and we will send options from owners and agents.
- Population
- 16,082INIDE 2023
- Elevation
- 9 m
- Mean temperature
- 28 °CJanuary: 27 °C
- Rainy season
- May to November
- To Managua
- 2 h 55 min144 km
- To MGA airport
- 2 h 40 min
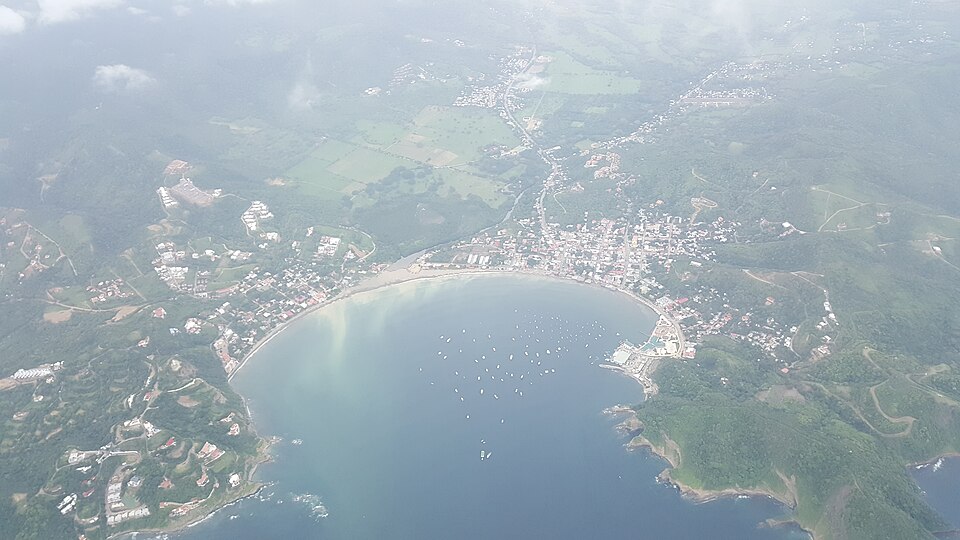

Homes in San Juan del Sur
-
 House
C$5,588 /month ≈ US$153House for rentSan Juan del Sur, Rivas
Marketplace · Nov 13View →
-
 House
US$160 /monthHouse for rentSan Juan del Sur, Rivas
Marketplace · Nov 13View →
-
 Apartment
US$200 /monthApartment for rentSan Juan del Sur, Rivas
Marketplace · Nov 13View →
-
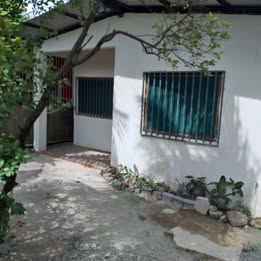 House
US$200 /monthHouse for rentSan Juan del Sur, Rivas
Marketplace · Nov 13View →
-
 Apartment
US$200 /monthApartment for rentSan Juan del Sur, RivasNear the beach
Marketplace · Nov 13View →
-
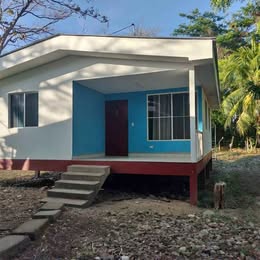 House
US$250 /monthHouse for rentSan Juan del Sur, Rivas
Marketplace · Nov 13View →
Listings posted on Facebook (Marketplace and public groups). We show the type, price and town; details, photos and contact are in the original post. Facebook labels many prices in córdobas even when they are in dollars, so the currency was inferred from each listing. Never pay or send a deposit before viewing the property. Is this your listing and want it removed? Write to us.
Climate
In San Juan del Sur the rainy season runs from May to November, with a drier spell in July (the canícula). The wettest month is October (≈316 mm) and the driest is January. The mean annual temperature is about 28 °C: April is the warmest month (30 °C on average) and January the coolest (27 °C).
The town sits at about 9 m above sea level.
Show the monthly data
| Month | Rain (mm) | Mean temp (°C) | Humidity (%) |
|---|---|---|---|
| January | 2 | 27.2 | 72 |
| February | 2 | 27.9 | 67 |
| March | 3 | 28.7 | 63 |
| April | 23 | 29.8 | 63 |
| May | 187 | 29.3 | 71 |
| June | 182 | 28.4 | 79 |
| July | 119 | 28.1 | 79 |
| August | 178 | 28.4 | 78 |
| September | 276 | 28.2 | 79 |
| October | 316 | 27.7 | 80 |
| November | 133 | 27.3 | 79 |
| December | 9 | 27.2 | 76 |
Getting there and around
San Juan del Sur is 144 km from Managua by road, about 2 h 55 min by car at the 50 km/h limit police have enforced since 2025, and 2 h 40 min from Managua International Airport (MGA). The nearest department capital by road is Rivas, 36 min away.
San Juan del Sur is on the Pacific side.
Compare with other towns
Before you move
Near San Juan del Sur
Sources: INIDE 2023 population estimate (via citypopulation.de); NASA POWER monthly climatology 2001–2025; Distances: OSRM on OpenStreetMap data (© OpenStreetMap contributors, ODbL); times at the 50 km/h limit; GeoNames (CC BY 4.0).